A graphical method of representing the control system using the linear algebraic equations is known as the signal flow graph. It is abbreviated as SFG. This graph basically signifies how the signal flows in a system.
The equation representing the system holds multiple variables that perform a crucial role in forming the graph.
Basically, if we have the set of equations that describes the system then by using the variables of the equation, the signal flow graph is obtained. This graph helps to get the interrelation existing between various variables of the system.
Introduction
In the previous article, we have discussed block diagram reduction of the control system that helps to simplify a complex system thereby analyzing the system by determining its transfer function.
We have seen that block diagram reduction was an efficient way of analyzing the system. However, in case of a complicated system, the block diagram reduction technique becomes quite difficult as well as time-consuming.
Thus, another method was proposed by S J Mason which is known as a signal flow graph. This method helps to relate the input and output variables of the system in a graphical manner.
It is noteworthy that by directly referring to the block diagram of a control system, the signal flow graph can be constructed.
Terms used in Signal Flow Graph
The common terms used in a signal flow graph are as follows:
1. Node: The small points or circles in the signal flow graph are called nodes and these are used to show the variables of the system. Each node corresponds to an individual variable. In the figure given below x1 to x8 are nodes.
2. Input node or source: The one having branches with only outgoing signal is known as the input node or source. For the below shown SFG, x1 is the source.
3. Output node or sink: A node that only contains branches with entering signal is known as a sink or output node. Both input and output nodes act as dependent variables. Here, x8 is the sink.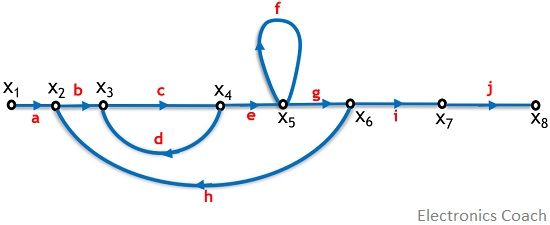
4. Mixed node: It is also known as chain node and consists of branches having both entering as well as leaving signals. For this SFG, x2 to x7 are mixed nodes.
5. Branch: The lines in the SFG that join one node to the other is known as a branch. It shows the relationship existing between various nodes.
6. Transmittance: The transfer function or gain between two nodes is said to be the transmittance of the SFG. Its value can be either real or complex. These are from ‘a’ to ‘j’ here.
7. Forward path: A path proceeding from input to output is known as forward path. Here one of the paths is x6 – x7 – x8.
8. Feedback loop: A loop which is formed through a path starting from a specific node and ending on the same node after travelling to at least one node of the graph is known as a feedback loop. It is to be noted that in the feedback loop, no node should be traced twice. Here the loop is x2 to x6 then back to x2.
9. Self-loop: A self-loop is the one which has only a single node. The paths in such loops are never defined by a forward path or feedback loop as these never trace any other node of the graph. Here it is formed at node x5 having gain f.
10. Path gain: When the signal flows in a forward path then the product of gains of each branch gives the overall path gain. For above-given graph, i*j is path gain for forward path, x6 to x8.
11. Loop gain: The product of individual gains of the branches that are in the form of loop is said to be the overall loop gain. For the loop forming between x3 and x4 the gain is c*d.
12. Non-touching loops: When two or more loops do not share common nodes then such loops are called non-touching loops. For this SFG, the two non-touching loops are x2-x6-x2 and x3-x4-x3.
Properties of Signal Flow Graph
- The signal from a node to other flows through the branch in the direction of arrowhead.
- The graphical method is valid only for linear time-invariant systems.
- The signal flowing through a branch is multiplied by the gain or transmittance of that branch. This product is equivalent to the node where that branch is terminating.
- Another crucial property of SFG is that, at any particular node, the value of the variable will be the algebraic summation of the signals coming to that node.
- The value that a node represents is not affected by the number of outgoing branches from that node.
- The signal flow graph never uniquely denotes a system as for a system multiple graphs can be formed by writing the equations differently.
Methods to Obtain Signal Flow Graph
There are two ways by which a signal flow graph can be constructed. One way to form an SFG is by using systems equation. While the other way of constructing SFG is by using the block diagram. So, let us see each method one by one.
SFG from system equations
The steps are as follows:
- First represent each variable of the equation by an individual node.
- Further, we know the value of the variable at a node is obtained by summing up all the signals that are coming to that node. So, draw the branches to that node accordingly.
- The coefficient of the variables present in an equation will be the gain of the branches that are joining the nodes.
- Furthermore, locate the input and output variables of the equations in the signal flow graph.
Let us understand this using an example. The system equations are as follows: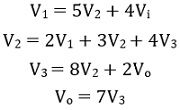
So, here Vi and Vo are the input and output variables respectively. While V1, V2 and V3 are the system variables.
Hence first, all the variables will be represented as nodes and further interconnection between the nodes using branches will be done.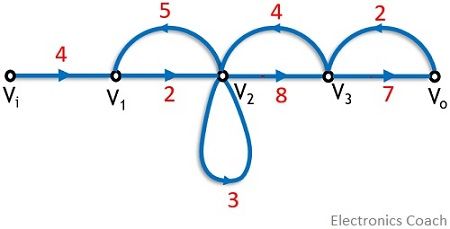
The branch gain is nothing but the coefficients of the variables. And the input and output variables complete the signal flow graph.
SFG from Block Diagram
The following are the steps to draw a signal flow graph:
- Here the summing and take-off points are represented by the nodes. Thus, all the summing and take-off points of the block diagram should be named and must indicate a specific node.
- Now, interconnect the various nodes using branches which was earlier connected through blocks in the block diagram representation.
Also, the block transfer function will now act as branch gain of the corresponding branch. - Further, show the input and output nodes individually in the signal flow graph to complete it.
Consider an example. The figure below shows a block diagram which is to be converted into the signal flow graph.
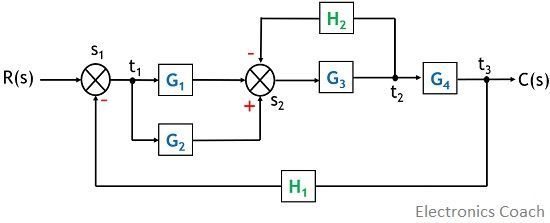
First, represent each and every take-off and summing point of the above-given block diagram as a separate node. Then replace the blocks of the above figure by branches in the signal flow graph.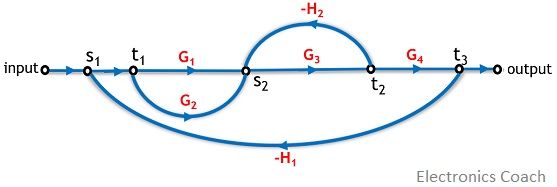
The branch gain corresponds to the transfer function of each block.
In this way using the block diagram of the system equation, a system can be represented in the form of a graph, known as a signal flow graph.
Priyanka Pawar says
good