Definition: Bode Plot is a graphical method used for design and analysis purpose of the control system. In the Bode Plot, a logarithmic scale is used that helps in simplifying the way to graphically represent the frequency response of the system.
The idea of logarithmic scaling was provided by Hendrick W. Bode.
In bode plot, logarithmic of magnitude and logarithmic of phase angle are separately plotted for logarithmic values of frequencies.
Need for Bode Plot
Previously we have seen that the basic form of frequency response curve represents a plot between magnitude and phase angle is sketched for various values of input frequency i.e., ω. In such plots, there is variation in ω from 0 to ∞ for which various values of magnitude and phase angle are achieved. However, accommodating all the values of magnitude and phase angle on a linear scale is quite difficult.
Thus, H.W. Bode proposed a different but powerful and helpful method for the purpose of stability analysis of the control system.
What is a Bode Plot?
As we have discussed recently that in polar plots a normal linear scale is used for sketching the magnitude vs phase angle response for various values of ω. But in bode plot, a logarithmic scale is used in place of normal linear scale.
Basically, by the use of a bode plot, a sinusoidal transfer function of a system can be represented by two separate plots. Out of the two plots, one plot corresponds to the magnitude vs frequency while the other corresponds to the phase angle vs frequency response of the system.
Also, all the 3 parameters on both the plots are sketched for the logarithmic scale.
So, more simply, we can say that a Bode Plot consists of 2 plots:
1. Magnitude Plot: In this plot, magnitude is represented in logarithmic values against logarithmic values of frequency.
For the transfer function G(jω)H(jω), in order to express the magnitude in logarithmic values, we need to find,![]()
And this magnitude in dB is plotted for log10 ω. This is represented in the general representation figure given below: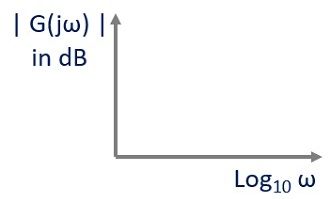
2. Phase Angle Plot: Here, the phase angle in degrees is sketched against logarithmic values of frequency.
Here, the angular value of G(jω) in degrees is sketched against log10 ω. The figure here represents the general representation of phase angle plot: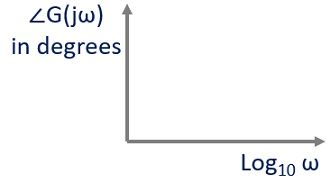
Bode Plot is also known as the logarithmic plot as it is sketched on the logarithmic scale and represents a wide range of variation in magnitude and phase angle with respect to frequency, separately. Thus, the bode plots are sketched on semi-log graph paper.
Also, as we can see that in both the plots the logarithmic value of frequency is scaled on the x-axis, so, x-axis can be kept common and both magnitude and phase angle plots can be drawn on the same log paper.
It is to be noted here that, suppose, we are having open-loop transfer function of the system G(jω)H(jω) and we have to determine the closed-loop stability by making use of frequency response of the open-loop system. Then, not simply G(jω) but magnitude and phase angle of G(jω)H(jω) is to be plotted against log10 ω.
Bode Plot of Standard Factors of Open-Loop Transfer Function
For the open-loop transfer function G(jω)H(jω), for each associated factors, the procedure of sketching the bode plot is given as:
- Change the given s-domain transfer function into the frequency domain by replacing s with jω.
- Determine the magnitude and express it in dB by the formula given:

- Now, determine the phase angle φ, in degrees by using:

- Further, consider the necessary approximations, plot the graph of magnitude and phase angle against log ω for various values of ω between 0 to ∞.
Let us now discuss each factor separately.
1. System Gain i.e., K
If
So, the magnitude in dB will be expressed as:![]()
In the above-given magnitude equation, due to the presence of constant K, the magnitude will always be constant for each value of ω between 0 to ∞. Thus, in the magnitude plot, this is indicated by a straight line parallel to the x-axis.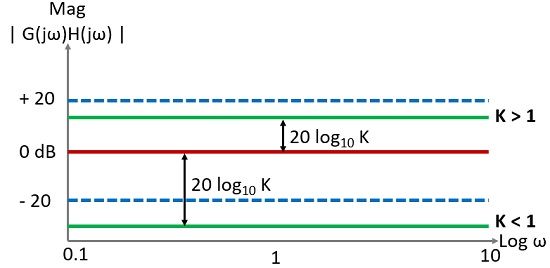
However, for K>1, the straight line will be present at 20 log K distance above the 0 dB reference line. While, for K<1, the line will be present below the reference line at a distance 20 log K.
This means in case of magnitude; the effect of K does not show variation. So, 20 log K dB is constant for all frequencies.
Since,![]()
The phase angle φ will be:
So, this shows, gain factor K contributes 0° to the phase angle plot.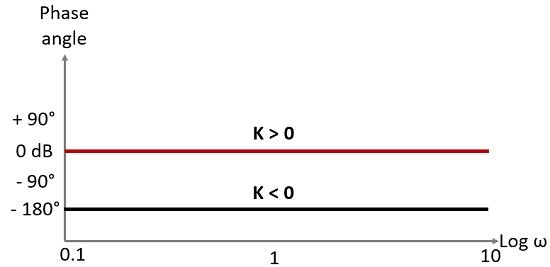
Thus, for every positive value of K, phase plot specifications remain invariable. However, for each negative value of K, it will contribute -180° to the phase angle of the plot for every value of K between 0 to ∞.
2. Poles or Zeros at the origin
Consider a single pole at the origin,![]()
In complex form,![]()
Now, calculating the magnitude,
Magnitude in dB will be given as:
This can be written as:![]()
Now let us check the magnitude changes for the various values of ω.
For ω = 1,![]()
For ω = 10,![]()
For ω = 100,![]()
For ω = 0.1,![]()
Here, we have taken the frequency as multiple of 10, this indicates the change as 1 decade. This signifies the magnitude here decades at the rate of -20 dB/decade.
Further for ω = 1, magnitude is 0 dB, so the slope of -20 dB will intersect the reference line i.e., 0 dB at ω = 1.
Moreover, the magnitude is + 20 dB and -20 dB at ω = 0.1 and ω = 10 respectively.
On the basis of this data the magnitude plot by 1 pole at origin is given as: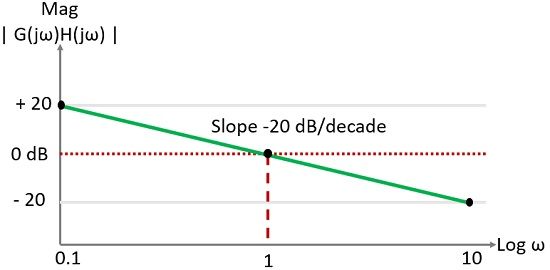
Now, calculating the phase angle,![]()
Here, the phase angle is independent of ω. Thus, the phase plot for 1 pole at origin is simply a line parallel to the x-axis.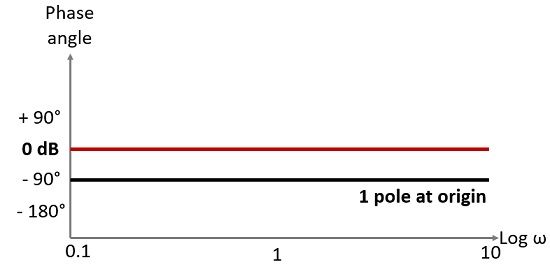
So, here we have given an idea about bode plot and in the upcoming article we see some examples to construct bode plot.
Kishan Ginoya says
Good to study from this.