Previously we have discussed that Bode Plot is a graphical representation that expresses response of the system using the logarithmic scale. In Bode plot logarithmic of magnitude and logarithmic of phase angle is plotted against logarithmic of frequency.
In the previous article, we have seen what a bode plot is and discussed the standard factors.
Here in this article, we will see how the bode plot is sketched and later will explain the same with the help of an example.
Steps to Construct Bode Plot
Bode Plot is known to have a separate sketch for magnitude and phase angle on the logarithmic scale against frequency. However, using a single semi-log paper both logarithmic of magnitude and logarithmic of phase angle values can be sketched against logarithmic frequency.
The steps to sketch the Bode Plot are as follows:
1. Firstly, write the given transfer function in the time constant form.
2. Next, identify the factors like K, poles and zeros at the origin, etc. and for the magnitude, plot determine 20 log10 K dB and sketch the line on the plot.
3. Further, a line with appropriate slope is to be drawn that represents poles and zeros at the origin that passes through the point of intersection ω=1 and 0 dB.
4. Now, the point of intersection is moved to line 20 log K and draw a line in parallel to the previous line. This basically adds the constant K along with a number of poles and zeros at the origin.
5. Next, the slope of this line is changed at various corner frequencies. It can also be said in a way that, the frequency that corresponds to the change in slope is known as corner frequency ωc.
Suppose, if ωc1 and ωc2 correspond to the two corner frequencies then the first change in slope will occur at ωc1 while the next slope will be changed at ωc2. This depends on the factor occurring at the corner frequency.
In case of the simple pole, the slope will be changed by -20 dB/decade while for simple zero it will be changed by +20 dB/decade etc. Also, it is to be noted here that no separate line is needed to be formed as each time the slope must be continued with the previously obtained resultant slope. Another noteworthy point over here is that at every corner frequency the slope must show the required variation.
6. Further, draw the phase angle table by substituting the various values of ω between 0 to ∞ and calculating the resultant phase angle. Now, by using these points, sketch a smooth curve to get the desired phase angle plot.
Example of Bode Plot
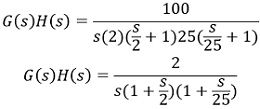
Consider a unity feedback system with![]()
and we have to sketch the Bode Plot for it.
So, the gain of the system:![]()
Therefore,
So, step 1 of bode plot construction includes an arrangement of G(s)H(s) in time constant form.
Further, let us identify the factors,
- K = 2,
- 1 pole is at the origin,
- Simple pole 1/(1+s/2) where T1 is 1/2 so, ωc1 = 1/T1 = 2,
- Simple pole 1/(1+s/25) where T1 is 1/25 so, ωc2 = 1/T2 = 25
Now, let’s proceed for the analysis to sketch the magnitude plot
Since, K = 2
Thus,![]()
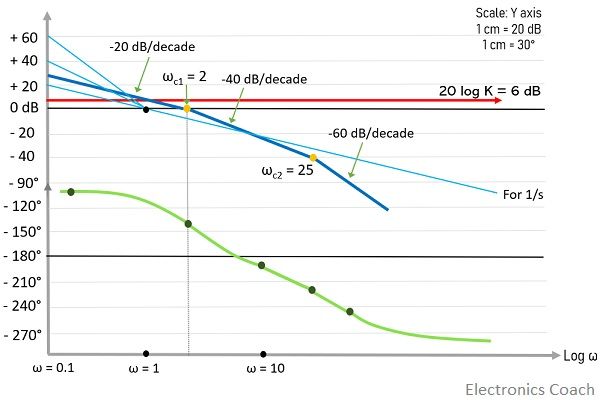
As it is clear that, 1 pole is at the origin so, a straight line of slope -20 dB/decade will pass through ω = 1 at 0 dB.
Now, the intersection point is to be moved in ’20 log K’ line and a line parallel to -20 dB/decade is drawn. This line is continued till the point of occurrence of first corner frequency i.e., ωc1 = 2.
As it is a slope for simple pole thus will contribute -20 dB/decade at ωc1 = 2. Hence, the resultant slope will be -20 – 20 = -40 dB/decade.
In this way, K, 1/s and 1/(1+s/2) is added and will be continued till the point of intersection with the next corner frequency i.e., ωc2 = 25.
Now, once the line is intersected at ωc2 = 25, again due to simple pole the contribution will be -20 dB/decade. Thus, the resultant slope after ωc2 = 25 will be – 40 – 20 = – 60 dB/decade. And as no other factor exists, hence the final slope will be – 60 dB/decade and will be the resultant of overall G(s)H(s).
Further, let us go for the analysis to sketch the phase angle plot
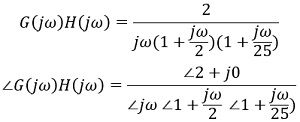
First, convert the s-domain representation into the frequency domain
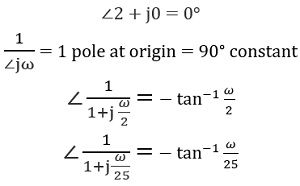
Here,
So, according to the above analysis, the phase angle table will be given as:
| ω | 1/ jω | -tan-1 ω/2 | -tan-1 ω/25 | φR |
| 0.2 | -90° | -5.71° | -0.45° | -96.16° |
| 2 | -90° | -45° | -4.57° | -139.57° |
| 10 | -90° | -78.69° | -21.80° | -190.49° |
| 25 | -90° | -85.42° | -45° | -220.42° |
| 50 | -90° | -87.70° | -63.43° | -241.13° |
| ∞ | -90° | -90° | -90° | -270° |
Now, using the magnitude and phase angle analysis, we need to construct the bode plot.
As we have to draw a straight line of -40 dB/decade from ωc1 = 2 and -60 dB/decade from ωc2 = 25, initially faint lines are drawn from the intersection point of ω = 1 and 0 dB, further parallel line is drawn to that line from the respective points.
Thus, the Bode Plot will be given as:
This is the desired plot sketched for the given transfer function of the control system that represents magnitude as well as phase angle against logarithmic of frequency.
Dr Sharmila Petkar says
Very clearly written, easy to understand.
Please add more content.
Mee She says
Thanks for this elaborate note. Please what did you do with the 6dB you calculated from K=2?