Definition: The plot that represents the transfer function of the system G(jω) on a complex plane, constructed in polar coordinates is known as Polar Plot.
The polar plot representation shows the plot of magnitude versus phase angle on polar coordinates with variation in ω from 0 to ∞. It is used for stability analysis.
Construction of Polar Plot
It is known to us that plotting frequency response signifies sketching the variations in the magnitude and phase angle with respect to the input frequency. These plots are known as magnitude plot (gain plot) and phase plot respectively.
In the Bode plot, the frequency response is sketched using a logarithmic scale.
So, in a polar plot, a sketch between the magnitude and phase angle of the transfer function G(jω) is formed for different values of ω.
Suppose M represents the magnitude and φ denotes the phase angle, then for the transfer function of a system it is given as: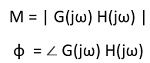
So, with the variation in ω from 0 to ∞, the values of M and φ can be determined.
As we have already discussed in the beginning that polar plot is magnitude versus phase angle graph plotted for various values of ω.
So, to construct a polar plot, the different values of magnitude and phase angle is tabulated and further, the sketch is formed. The table is given below:
| Frequency | Magnitude | Phase Angle |
| 0 | M0 | φ0 |
| ω1 | M1 | φ1 |
| ω2 | M2 | φ2 |
| | | | | | |
| | | | | | |
| ∞ | M∞ | φ∞ |
Basically, here each point on the polar plot is significantly plotted for each specific value of magnitude and phase angle for particular frequency ω.
Like from the above table, for ω = ω1, M = M1 and φ = φ1 a point in the polar coordinate system is decided that represents M1∠φ1, hence, the point on the plot corresponds to the tip of the phasor of magnitude M1 plotted at an angle φ1.
So, by using the tabulated data, the polar plot can be formed. Thus, in this way, the magnitude vs phase angle plot is can be constructed for various values of frequency.
It is to be noted here that conversion of magnitude into dB or logarithm values is not necessary. Also, the anticlockwise direction represents positive phase angles, while the clockwise direction shows the negative phase angles.
The figure below represents the polar plot for ω between 0 to ∞: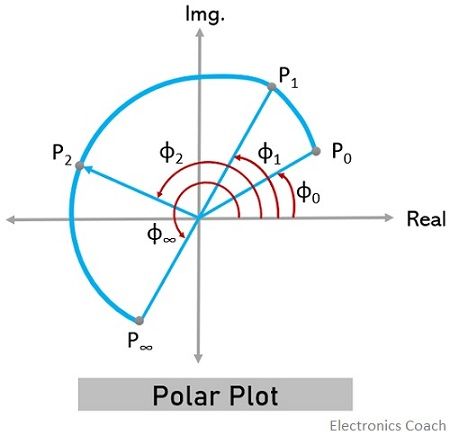
Thus, from the above discussion, we can conclude that polar plot is started from a point specifying magnitude and angle for ω = 0 and is terminated at a point specifying magnitude and angle for ω = ∞.
- Another method is used to roughly sketch a polar plot in which magnitude and angles for the various values of ω are not calculated.
Basically, in a polar coordinate system, suppose we have two points n1∠φ1 and n2∠φ2 as indicated below: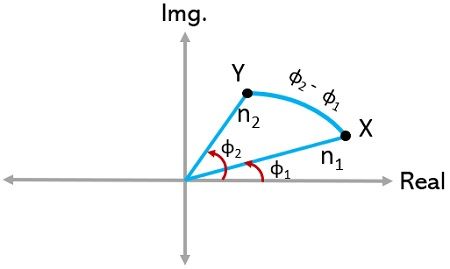
Here, it is clear from the above figure that movement of point X from Y, causes an angle rotation, φ2 – φ1. And if the difference is negative, the rotation will be in the clockwise direction. While, if the difference is positive, the rotation will be in the anti-clockwise direction.
In a similar way, the variation in ω from 0 to ∞, two points can be considered. One at ω = 0, with magnitude M0 and angle φ0 while the other at ω = ∞ with magnitude M∞ and angle φ∞. Then there will be a rotation from φ∞ to φ0.
More simply,
ω = 0 gives M0 ∠φ0 is the starting point,
ω = ∞ gives M∞ ∠φ∞ is the terminating point and
φ∞ – φ0 corresponds to the rotation
Hence, in this way, the polar plot can be constructed.
Example of Polar Plot
Till now, we have discussed what basically a polar plot is and how it is constructed let us now consider an example to understand the construction of polar plot in a better way.
Suppose we have a Type 0 system whose transfer function is given as: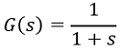
We have to sketch the polar plot for it.
The first step is to convert the given transfer function into the frequency domain. Thus, it will be written as: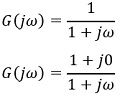
Now, further calculating the magnitude,![]()
Also, the phase angle condition,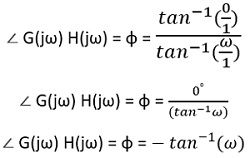
Now, we have to calculate magnitude and angle by substituting different values of ω between 0 and ∞.
Thus, the tabular representation will be:
| Frequency | Magnitude | Phase Angle |
| 0 | 1 | 0° |
| 1 | -45° | |
| 10 | -84.2° | |
| | | | | | |
| | | | | | |
| ∞ | 0 | -90° |
Hence, the tabulated data shows that the starting point is 1 ∠0° and terminating point is 0 ∠-90°. Thus, the plot will terminate at the origin, tangential to the axis of angle -90°.
Thus, the plot is represented as: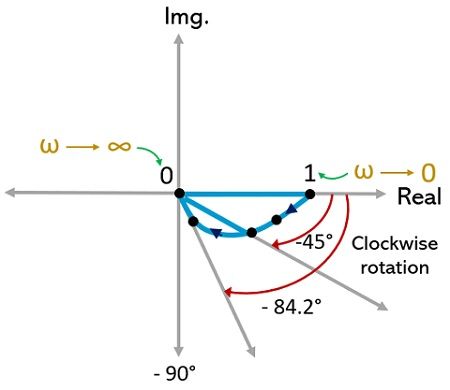
Now, let us apply the alternative method to sketch the polar plot.
As we have discussed earlier that in this method only the starting and terminating points are of major significance. Thus, frequency is needed for 0 and ∞.
From the above tabular representation, it is clear that,
For, ω = 0 magnitude and angle = 1 ∠0°
For, ω = ∞ magnitude and angle = 0 ∠-90°
Therefore,
φ∞ – φ0 = -90° – 0° = – 90°
As the difference of the two is negative, thus, the rotation from starting to the terminating point will be in the clockwise direction.
Thus, the starting point, 1 ∠0° is rotated 90° in the clockwise direction, in order to get terminated at 0 ∠-90°. Hence, the rough sketch of the polar plot is given below: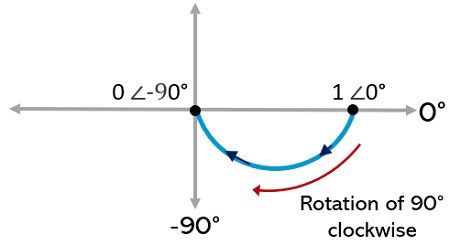
It is to be noted here that mostly this approximate method is used for sketching the polar plot.
Leave a Reply